


SEJournal Online is the digital news magazine of the Society of Environmental Journalists. Learn more about SEJournal Online, including submission, subscription and advertising information.
September 18, 2024
 |
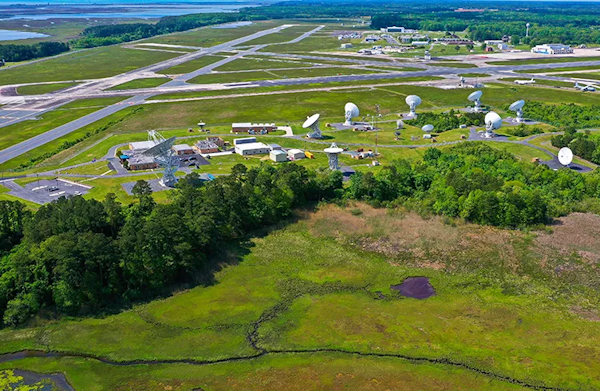 |
| The Wallops Command and Data Acquisition Station in Wallops Island, Virginia, which fields a continuous flow of environmental data from a wide range of satellites. Photo: National Oceanic & Atmospheric Administration. |
Reporter’s Toolbox: Worldview Data Expands Environment Reporter’s Strike Zone
By Joseph A. Davis
If you ever go to Wallops Island, Virginia (perhaps on the way to Chincoteague to see the annual pony swim), you will be struck by a large field full of dish antennas aimed skyward.
They are one important gateway through which the oceans of data from Earth-observing satellites enter the archives and servers of federal agencies — and ultimately the computers of Earth scientists.
NASA mostly flies the satellites, but other agencies like the National Oceanic and Atmospheric Administration engineer the satellites and study the data. Some of the raw data is open and available to the public (and journalists).
The amount of data is unimaginably huge.
Fortunately, there is a system (or a
system of systems) for handling it.
The amount of data is unimaginably huge. Fortunately, there is a system (or a system of systems) for handling it. It goes by the acronym EOSDIS, for Earth Observing System Data and Information System.
Meanwhile, NASA’s query site, called Worldview, translates some of the most meaningful data into graphic form. You can access the Worldview landing page, which is also the query engine, here.
The Worldview database is a cool tool that environmental journalists (and their production teams) should know about. It’s not simply data; it’s free graphics.
Where the data comes from
We know that NASA, NOAA and other federal agencies work pretty hard to calibrate and check the accuracy of their satellite instruments — so we don’t have doubts about the accuracy and quality of the data.
Each satellite or instrument has its own special purpose and, er, worldview.
What varies is orbit, spatial coverage, what the instruments are trying to see, which parts of the spectrum each instrument records and how often images are recorded. Many, for example, are looking at clouds. Others may be looking at water or vegetation.
How to use the data smartly
As powerful as the Worldview site is, it’s not easy to use. Some important parts of it just don’t work. And the interface is awkward, although this is partly a result of all the choices you have in how you look at the planet.
The “user experience” experts probably wouldn’t give it a high grade. On the other hand, the number of choices you have about what to look at is very large.
You can request many different time spans ...
and you can choose particular places,
zooming in and out almost at will.
Just some examples: You can request many different time spans, you can compare views from one time period against another, and you can choose particular places, zooming in and out almost at will.
That’s just the beginning. You want to look at clouds? You can look at cloud tops, cloud coverage, aerosol albedo, aerosol optical depth, cloud layers, cloud reflectance, etc.
Images, data for environment stories
It may be obvious, but this data, these pictures, is right in the strike zone of stories environmental journalists often cover.
You can find out about wildfires, floods, dust storms, smoke plumes, drought, vegetation cover, human built-up areas and settlement areas, and even dams. And more.
It’s also very climate-centric. It tells you many details about albedo, sea-ice cover, surface temperature, etc.
The nonobvious way to get there is to click on the little red button marked “add layers.” Then, when you see all the choices, click on the near-invisible submenus to see even more.
And when you talk to your graphics department about Worldview, point out that you can add layers showing all kinds of other map features: coastlines, roads, water bodies and more. Not only that, you can use Worldview to place your own labels on the map.
Joseph A. Davis is a freelance writer/editor in Washington, D.C. who has been writing about the environment since 1976. He writes SEJournal Online's TipSheet, Reporter's Toolbox and Issue Backgrounder, and curates SEJ's weekday news headlines service EJToday and @EJTodayNews. Davis also directs SEJ's Freedom of Information Project and writes the WatchDog opinion column.
* From the weekly news magazine SEJournal Online, Vol. 9, No. 33. Content from each new issue of SEJournal Online is available to the public via the SEJournal Online main page. Subscribe to the e-newsletter here. And see past issues of the SEJournal archived here.
SEJ Publication Types:
Topics on the Beat:
Region:
Visibility: