SEJournal Online is the digital news magazine of the Society of Environmental Journalists. Learn more about SEJournal Online, including submission, subscription and advertising information.
 |
 |
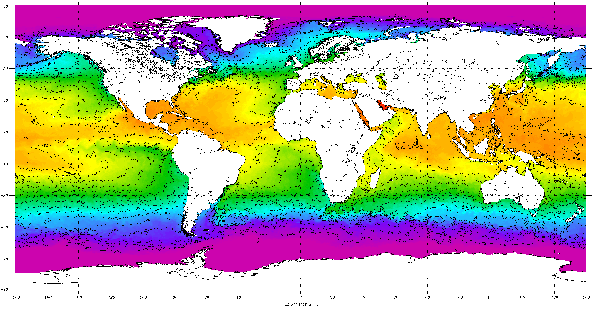
| NOAA and other agencies synthesize a wide range of data to produce products like this sea surface temperature contour chart, which can be used to tell a variety of environment stories. Image: NOAA Office of Satellite and Product Operations. |
Reporter’s Toolbox: Sea Surface Temperature Data Tells Many Environmental Stories
By Joseph A. Davis
Data on sea surface temperatures can be an adjunct to many worthwhile environmental stories. It’s available online abundantly and quickly to anyone.
Just one example of reporting angles: hurricanes and tropical storms. They are fueled by heat energy drawn from warm ocean waters. So if waters in the Gulf of Mexico are especially hot, hurricanes passing into the Gulf will explode, displaying the rapid intensification that has been alarming meteorologists in recent years. Pack your go bag.
But that’s hardly the end of it. If you live in a coastal area plagued by “red tide” and harmful algal blooms, you know that high water temperatures ring an alarm. Infections from vibrio bacteria, which grow in warmer waters, can sicken and even kill people. Cholera is a form of vibrio.
Or let’s say you write about the Chesapeake Bay, a huge, beloved and productive regional resource for people who like boats and blue crabs. Its temperature has been rising — harming eelgrass and the whole huge estuarine ecosystem, which is struggling.
Sea surface temperatures are what tell scientists about changes in the El Niño cycle, which has profound global effects. The temperatures tell fishers where to fish. They tell sea turtles where to swim.
Where the data comes from
One good place to get this data is from the National Oceanic and Atmospheric Administration (start here).
NOAA gets a lot of its data from
satellites but it and other agencies
also measure sea surface temperature
with stationary mid-ocean buoys,
research vessels, drifters and gliders.
NOAA gets a lot of its data from satellites, which are accurate if enough scientists work hard enough to calibrate them. There are many, from many nations. They typically measure and map infrared radiation from the top ocean layer.
But a lot more goes into the ultimate data product. NOAA and other agencies also measure sea surface temperature with stationary mid-ocean buoys, research vessels, drifters and gliders. All these data sources are synthesized in a mashup called, for example, the Geo-Polar Blended Sea Surface Temperature Analysis.
Bottom line: The data is as reliable as scientists can make it. And it’s changing all the time.
How to use the data smartly
How you should use the data depends on what questions you want to answer.
One suggestion is to talk to experts, including researchers in the oceanography and marine science departments at your local university or institute.
Another is to be aware of the depth of the waters being measured. Oceans have layers, not to mention upwellings and currents. Many infrared satellite sensors only look at the top few millimeters of water. Other instruments go deeper.
If you are simply trying to anticipate tropical storms, remember that hurricane forecasts are put together by experts from many data sources. Talk to specialists like those at the National Hurricane Center.
As always, we recommend that you not neglect the human (or biological) aspect of your story. While you can’t talk to the turtles, you can talk to the turtle catchers and rescuers. Groundtruth everything you can.
[Editor’s Note: For more, see our Topic on the Beat pages on hurricanes and on water and oceans, which include numerous SEJournal stories, plus EJToday headlines.]
Joseph A. Davis is a freelance writer/editor in Washington, D.C. who has been writing about the environment since 1976. He writes SEJournal Online's TipSheet, Reporter's Toolbox and Issue Backgrounder, and curates SEJ's weekday news headlines service EJToday and @EJTodayNews. Davis also directs SEJ's Freedom of Information Project and writes the WatchDog opinion column.
* From the weekly news magazine SEJournal Online, Vol. 9, No. 31. Content from each new issue of SEJournal Online is available to the public via the SEJournal Online main page. Subscribe to the e-newsletter here. And see past issues of the SEJournal archived here.


 Advertisement


