


SEJournal Online is the digital news magazine of the Society of Environmental Journalists. Learn more about SEJournal Online, including submission, subscription and advertising information.
November 15, 2023
 |
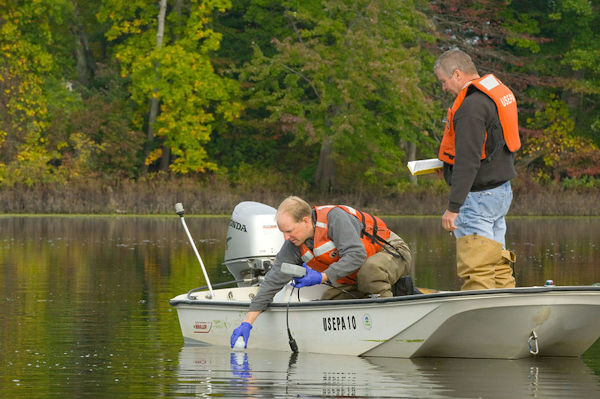 |
| A new data exchange offers access to extensive water quality records via a collaborative effort among federal, state and tribal agencies. Above, EPA scientists collect water samples for analysis. Photo: U.S. Environmental Protection Agency via Flickr Creative Commons (United States government work). |
Reporter’s Toolbox: Data Portal Takes Measure of Water Quality
By Joseph A. Davis
Can you swim in that river? Can you eat fish from it? Can you fill your canteen?
There’s a database for that. But don’t bet your health on it. It’s been a while since Toolbox looked at data sources about ambient water quality, so it’s time for a refresher.
The data landscape for water quality monitoring has changed a lot in the last five years. The U.S. Environmental Protection Agency junked its old STORET data system in June 2018 (you can find the husk of the old STORET here). It has been replaced by something called WQX, or Water Quality Exchange.
Hard chargers may want to just start fiddling with the WQX data at this search portal. Officially named the Water Quality Portal, it allows you to request data by many parameters, limiting your search. What you get back is raw data.
Where the data come from
The roughly 380 million water quality records you can get from the Water Quality Portal are maintained by a partnership that includes the EPA, the U.S. Geological Survey and other agencies via the National Water Quality Monitoring Council. The whole team involves some 900 federal, state and tribal agencies, watershed organizations and other groups.
We won’t downplay the challenges of
maintaining data quality in such a
sprawling project. One huge problem
is consistency in standards and format.
We won’t downplay the challenges of maintaining data quality in such a sprawling project. One huge problem is consistency in standards and format. But EPA and USGS are pretty good at doing this. Toolbox has written previously about water data from USGS, for instance, an inherently scientific agency largely without a policy agenda.
It’s nonetheless true that the bulk of the data comes from the states. So for specific places, you might want to check in with the state or tribal water quality agency — if only because it may be fresher.
Using the data smartly
From the start, try to remember that water quality is not static. A big storm, a big discharge or a seasonal event can change everything, sometimes exponentially. So it’s important to look at readings over different periods of time and to sharpen your inquiries by looking at averages.
You will also want to be aware of what water quality “parameters” (kinds of measurements) are most relevant to your story. And remember that the story only begins with numbers.
Are pathogens the problem? Is the problem storm overflows, rank septic tanks or failing treatment plants? Is arsenic the problem? To what extent is the source something like naturally occurring groundwater — and how can a community fix it?
Cross-check your data against things like beach closures and fish consumption advisories. Is swimming allowed? How does measured water quality stack up against EPA and state water quality standards?
Pay attention to the political story
that probably lurks behind the data.
Some states are slow or reluctant
to confront water quality problems.
Finally, pay attention to the political story that probably lurks behind the data. Some states are slow or reluctant to confront water quality problems.
Has the state issued a “total maximum daily load” for a given pollutant and water body? Who is arguing against it and what is their interest? Check in with your local water utilities and get their view.
As always, we advise you to groundtruth everything you can. Researchers at nearby research universities can often give perspective about the data’s strengths and weaknesses. And don’t neglect to do the human-dimension reporting that sets the data in context.
[Editor’s Note: For more, visit our Topic on the Beat: Water & Oceans page, which includes more Toolboxes, plus TipSheets, Backgrounders, Features and more, as well as water headlines from our EJToday news curation service.]
Joseph A. Davis is a freelance writer/editor in Washington, D.C. who has been writing about the environment since 1976. He writes SEJournal Online's TipSheet, Reporter's Toolbox and Issue Backgrounder, and curates SEJ's weekday news headlines service EJToday and @EJTodayNews. Davis also directs SEJ's Freedom of Information Project and writes the WatchDog opinion column.
* From the weekly news magazine SEJournal Online, Vol. 8, No. 41. Content from each new issue of SEJournal Online is available to the public via the SEJournal Online main page. Subscribe to the e-newsletter here. And see past issues of the SEJournal archived here.
SEJ Publication Types:
Visibility: